


Valuing Dave: Waitin' On a Payday
Over the past year Dave has seen 164% increase in it share price. Is the investor confidence justified?
What do Dave, a fintech company, and Shark Tank have in common? No, it wasn’t a startup pitched on the show but, Mark Cuban, one of the sharks, was an early investor.
Dave was founded in 2017 and went public five years later via a SPAC merger at a $4 billion valuation. Since then the ride has been bumpy to say the least - after peaking at nearly $360 per share post-launch , the stock fell into penny stock territory by year-end, prompting a 1-for-32 reverse stock split to avoid getting delisted from the exchanges. By mid-2023, the company’s market cap had plunged to 55M - a staggering 98% drop of in under two years. The broader index over the same time frame had barely lost a quarter of a percentage point.
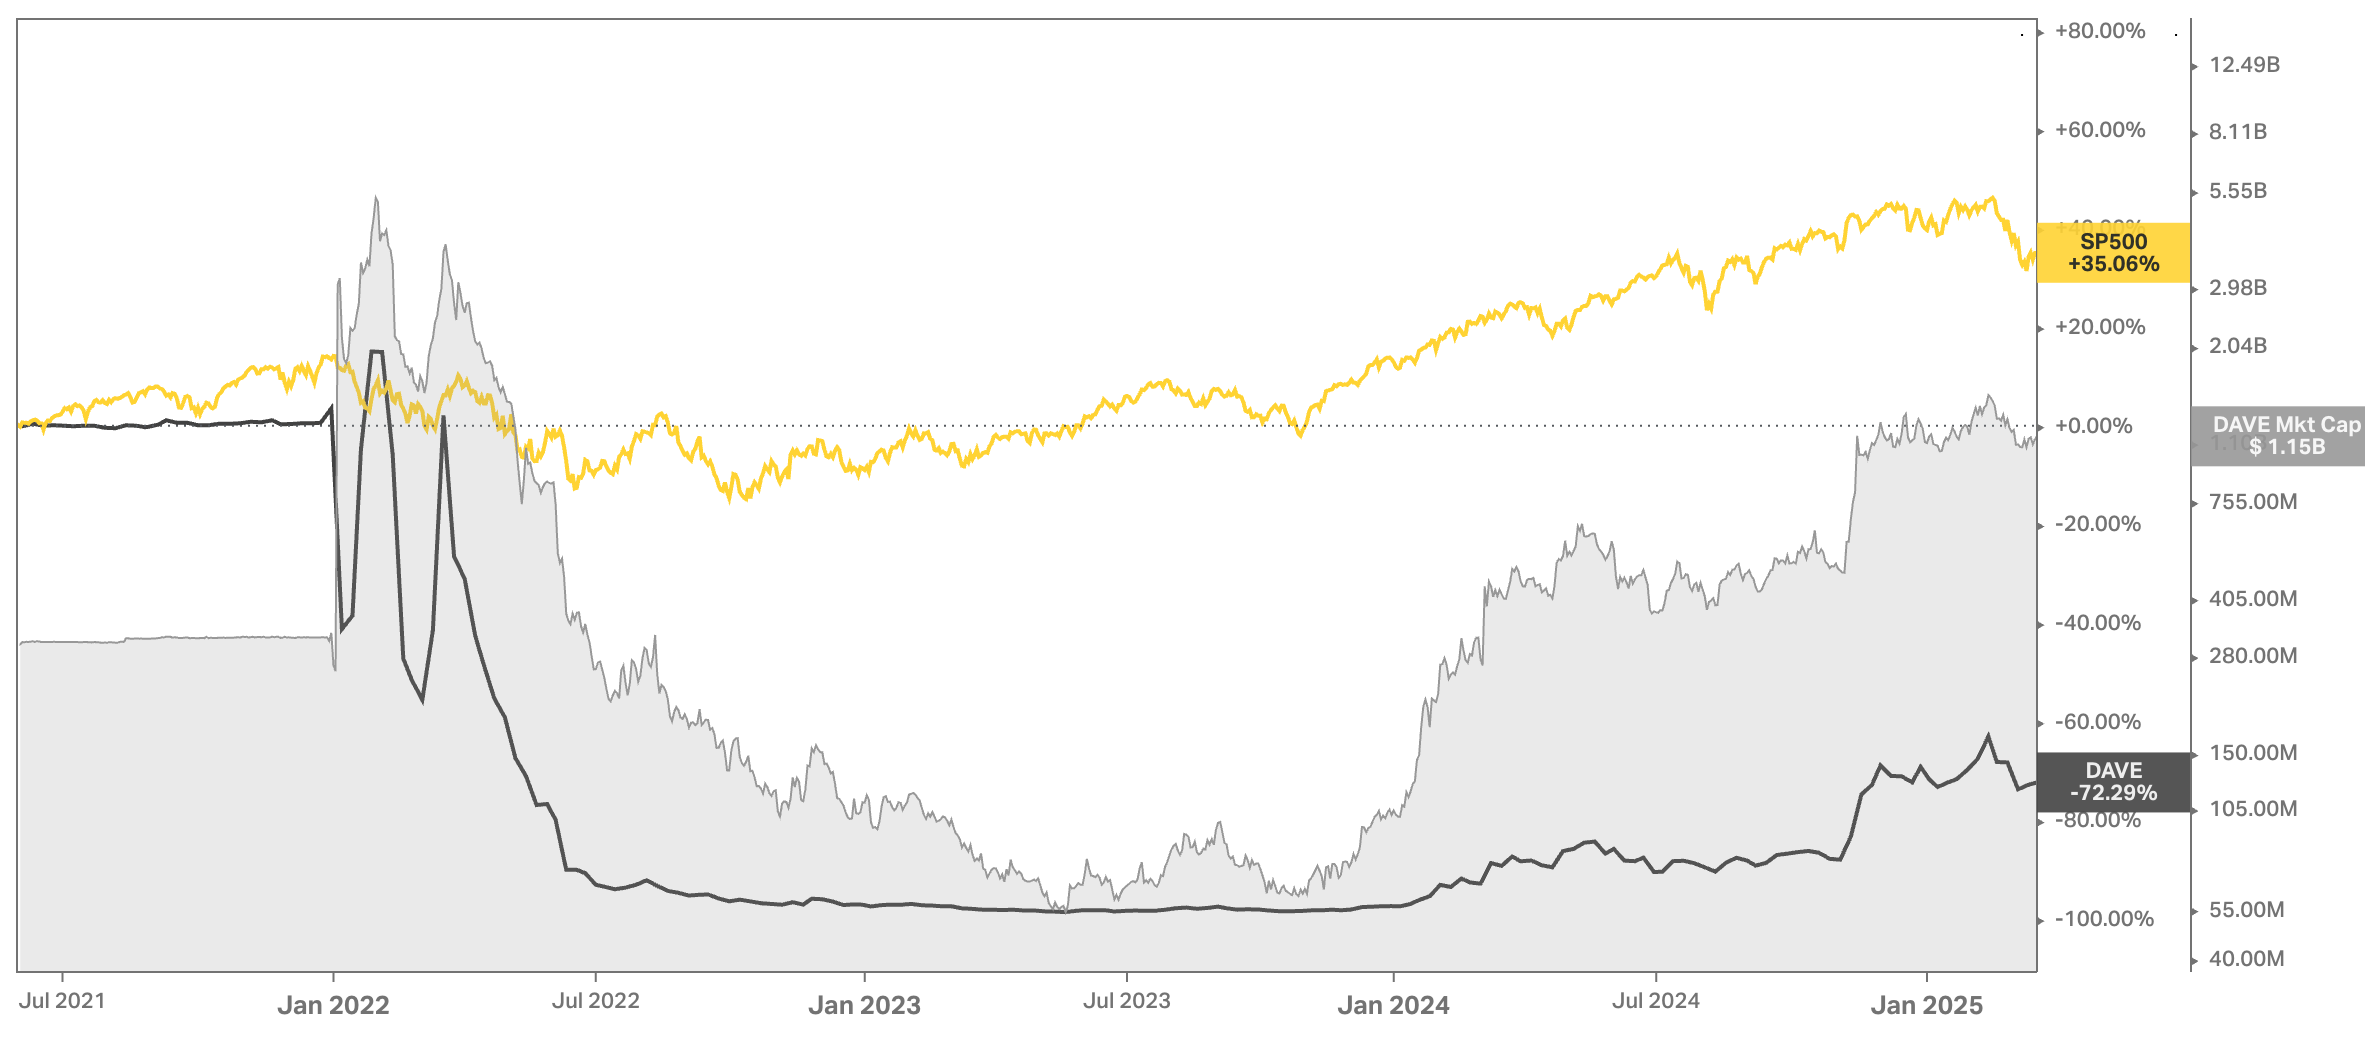
And yet, the story has taken a surprising turn. Since May 2024, the stock is up 164%, outpacing the broader market’s 10% gain. Its current market cap sits around $1.1 billion, and it even turned a profit in 2024, reporting ~$60 million in net income.

Given this dramatic rebound, I wanted to dig in: Is the tenfold increase in stock price- now hovering around $85 - justified? And is the market valuing Dave fairly today?
The Business Model
Dave sets itself apart from traditional brick-and-mortar payday lenders by offering a fully digital experience through its app. It also differentiates with features such as no credit checks, no interest or late fees. In addition, non-payment penalties are minimal - accounts aren’t reported to credit bureaus or sent to collection agencies. Dave positions itself as a low-cost financial lifeline for those living paycheck to paycheck. The average loan is around $170 and is typically repaid within 11 days.
As a business, Dave earns revenue through three primary channels:
A small monthly subscription fee
Fees for expedited transfers, and
Optional tips from users. Tips have been replaced, in response to a lawsuit, with a flat 5% overdraft fee, capped at $15 on the high end and $5 on the low end.
Additional offerings - included with the monthly subscription - are a digital checking account (offered via a partner bank), a debit card with ATM access, a budgeting tool, a job board called “Side Hustle,” and the ability to earn small amounts of cash through paid surveys. At first glance, many of these features seem aimed at addressing the retention challenges that typically plague companies with subscription-based revenue models.
Market Size and Competition
In its 10-K, Dave cites a total addressable market (TAM) of 180 million Americans living paycheck to paycheck. That figure seems highly inflated, so I dug into one of their cited sources—PYMNTS—and found a more grounded estimate: roughly 21% of Americans (~37 million) live paycheck to paycheck out of necessity. This narrower segment feels like a more realistic reflection of Dave’s actual target market.
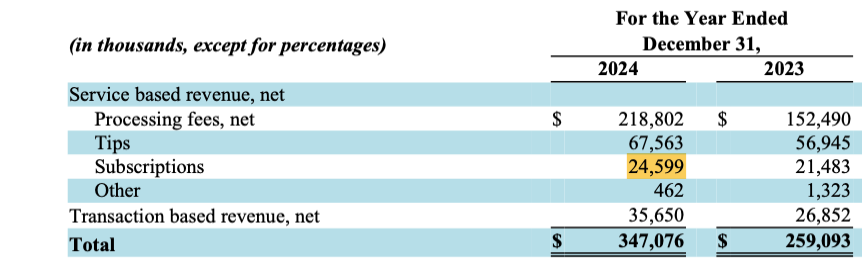
Using Dave’s reported annual subscription revenue of $24.6 million and assuming Dave collects $12 per subscriber per year, we can estimate a subscriber base of approximately 2.05 million. That implies Dave currently holds around 5% market share within this core segment.
In terms of competition, Dave operates in a large, fragmented, and highly competitive consumer financial services market. Given its product mix, it competes across multiple categories - ranging from traditional banks like Wells Fargo, Chase, and Bank of America to peer-to-peer payment platforms like CashApp and Venmo, and digital providers such as Chime and Varo.
That said, Dave’s core competitive set is likely concentrated in the earned wage access (EWA) space, where a growing number of apps offer early access to wages. Key players here include EarnIn, Upstart, Brigit, MoneyLion, Cleo, FloatMe, Empower, among others.
The Valuation
Revenue Growth
In 2024, Dave generated $347 million in revenue—a 34% increase over the prior year. Despite this sharp growth, I expect revenue to grow at a slower pace of 22% in 2025 largely due to a reduction in marketing spend. In 2023, Dave spent nearly 18.5% of its revenue on marketing, but that figure dropped to 12% in 2024. While management appears to be shifting focus toward efficiency, this pullback in customer acquisition spend is likely to dampen near-term growth.
Additionally, the revised fee structure - charging users between 5% and 15% of the borrowed amount - in a fragmented and highly competitive market, could lead to customer attrition particularly among price-sensitive users who may turn to lower-cost alternatives. Over the next decade, I’ve assumed that revenue growth will gradually decline to the long-term risk-free rate of 3.00%, reflecting both increased competitive pressure and the long-term impact of higher fees. Based on current revenue projections, Dave is expected to generate around $1.2 billion in revenue by 2025.

According to a report by market.us, the U.S. payday loans market is projected to reach approximately $18 billion by 2035, representing 35.6% of a $52.3 billion total market. At $1.2 billion in revenue, Dave would command roughly 6.5% of the overall market share at that point.
Margins
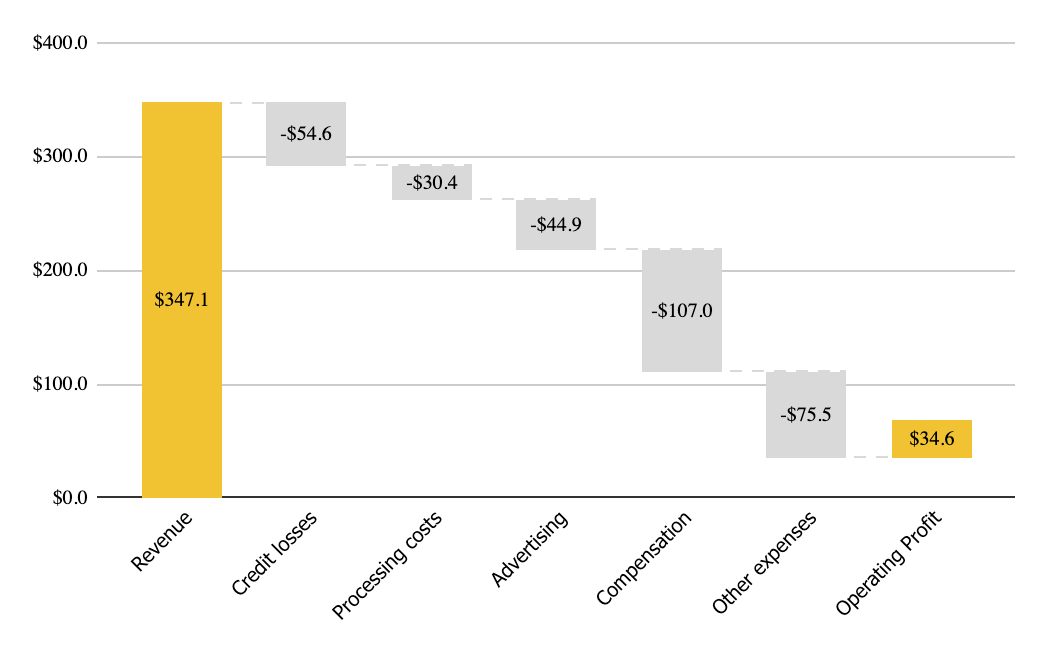
Dave’s pre-tax operating margin is 9.96% (34.6/3471.) I’m assuming that this’ll gradually improve to 16.33% over the next 10 years due to increased fees, better loss management and increased stickiness/expansion of its subscription offerings. This improved margin is also in line with the average margin for the Financial Services industry in the US.
Tax Rate
I’m assuming that the effective rate will increase to the marginal tax rate of 21% over the next 10 years.
Reinvestment
In 2024, Dave generated $1.67 in revenue for every dollar of invested capital. I’ve assumed this ratio holds steady over the next five years, then gradually rises to $2.55. This improvement reflects the company’s low capital intensity—no physical storefronts, rapid cash turnover (with loans outstanding for just 11 days), and strong revenue relative to loan originations ($347M in revenue on $5.1B in originations)—all of which support increased efficiency over time.
Return on Capital
A key driver of returns in the future will be Dave’s ability to originate high-quality loans while keeping credit losses in check. The company is making clear progress on this front - credit loss write-offs declined from 2.09% (75M/3.1B) of originations in 2023 to 1.26% (64M/5.1B) in 2024.
Dave’s current ROIC is 15.93%. I expect it to improve to 25–30% over the next decade as the business scales and operational efficiency improves. From Year 10 onwards, I assume ROIC will gradually normalize to 17.68% - the industry average for the Total Market (excluding financials).
Cost of Capital (WACC)
Cost of Equity (Re): Dave has a 5-year monthly beta of 3.53, reflecting its significant stock price volatility. Using an equity risk premium (ERP) of 4.33% and a risk-free rate of 4.35% (based on the 10-year Treasury yield), the resulting cost of equity is 19.63%.
Cost of Debt(Rd): The cost of debt is 10.62% based on its Interest Expense and EBIT.
Since, Dave’s debt of $75M is negligible in comparison to the market value of relative to its equity (over 1B+) my calculation of WACC(Wd *Rd(1-t) + We * Re) is 19.63%
Valuation Model

The sum of the present value of projected cash flows over the next 10 years is $233.82. Adding the present value of the terminal value -$577.58 brings the enterprise value to $811.49. Subtracting net debt - $75.2 in debt and adding back cash - yields an equity value of $786.01. After accounting for outstanding options, valued at $39.68, the value of common equity comes to $746.33.
With 14.29 million shares outstanding (including RSUs), this translates to a fair value estimate of $52.51 per share. The stock currently trades at $84.55.
Factoring in Uncertainty
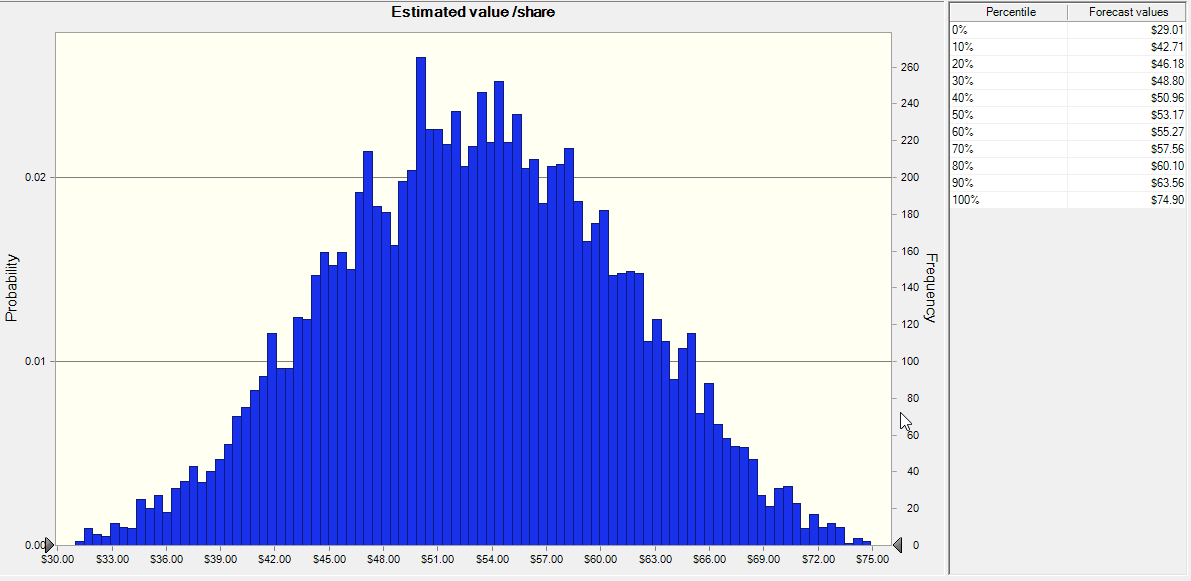
The two assumptions I was most uncertain about were the operating margin and the target ROIC in perpetuity. To account for this uncertainty, I ran a Monte Carlo simulation using a triangular distribution for the operating margin (ranging from 12.70% to 19.96%) and a uniform distribution for ROIC (ranging from 8.68% to 24.45%).
The simulation generated a distribution of estimated share values. Based on the results, there’s only a 10% probability that the stock is worth more than $63.56. The median estimated value is $53.17—well below the current trading price of $84.55—suggesting the stock may be significantly overvalued under most plausible scenarios.
The BottomLine

Dave shares appear to be trading at a steep premium to intrinsic value. The recent surge in its stock price is likely driven by its first year of meaningful profitability since inception. However, what investors may be overlooking is that nearly half of this profit—approximately $33.5M—came from gains on its convertible debt. That debt was held by FTX—the same beleaguered firm that went bankrupt and landed its founder, Sam Bankman-Fried, in prison. The fact that Dave was entangled with a collapsed crypto firm is, in itself, wild and raises serious corporate governance red flags.
For now, investing in Dave doesn’t look like a path to a payday!
Disclaimer: This analysis is for informational purposes only and does not constitute investment advice, a recommendation, or an offer to buy or sell any securities. Please conduct your own research or consult a financial advisor before making any investment decisions.
Great breakdown. Looking forward to future articles.